
ESSAY |
www.youthlabourforce.cjb.net |
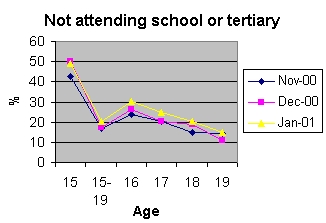
Not attending school or tertiary institution. Aged Nov-00 Dec-00 Jan-01 15 42.7% 50.3% 49.3% 15-19 16.7% 17.5% 20.5% 16 23.9% 26.4% 30.3% 17 20.1% 20.3% 24.7% 18 14.7% 18.7% 20.4% 19 14.2% 10.9% 14.9% |
This graph shows that, in January 2001 there has been a substancial increase in the
percentage of people aged 15-19 not attending school or tertiary education.
|

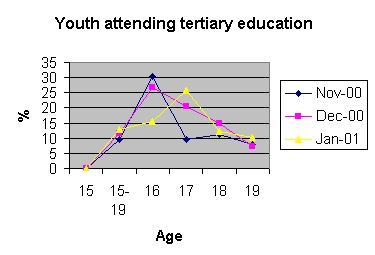
Attending tertiary institution Aged Nov-00 Dec-00 Jan-01 15 0% 0% 0% 15-19 9.6% 11.4% 12.8% 16 30.4% 26.8% 15.4% 17 9.7% 20.4% 25.8% 18 11.1% 15% 12.3% 19 8% 7.4% 10.2% |
The major trends that occur in this graph show that, 0% of the 15 year olds in Australia
don't attend a tertiary instiution. As you can see, the 16 year old percentage
is going down increasingly as the months progress. This is the result of
VET courses and AUS study introduced by the federal government. |
www.youthlabourforce.cjb.net |
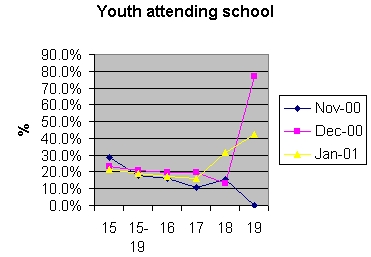
Attending school Aged Nov-00 Dec-00 Jan-01 15 28.4% 23.2% 21.3% 15-19 18.1% 20.7% 18.8% 16 15.9% 19.4% 17.2% 17 10.9% 19.6% 15.9% 18 15.2% 13.1% 31.8% 19 0.0% 76.8% 42.2% |
The major trends that occur in this graph are, that percentages in recent trends
are increasing significantly for youth to stay in school. Again this is the result of VET and AUS
study programmes that the government has introduced to encourage youth to not
enter the labour force. This has become an insentive for the youth population
to stay in school. |
www.youthlabourforce.cjb.net |
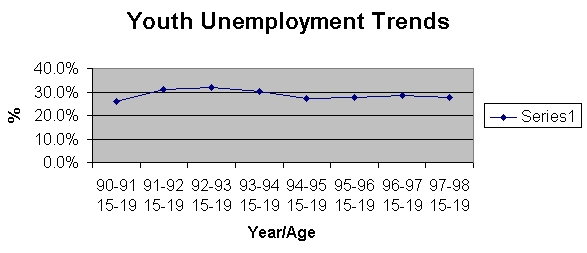
Youth Unemployment Age Year % 15-19 90-91 25.8% 15-19 91-92 31.0% 15-19 92-93 32.1% 15-19 93-94 30.2% 15-19 94-95 27.2% 15-19 95-96 27.8% 15-19 96-97 28.7% 15-19 97-98 27.7% |
This graph of trends shows that in the late 90s, youth unemployment has been stabilised
due to the federal government introduced programmes that would encourage
the youth to stay at school. To keep reducing this figure they need to expand
on their existing programmes and/or introduce more. |
www.youthunemployment.cjb.net |
